
This year I’ve been experimenting with BroodminderTH1 © Temperature and Humidity sensors inside some of the hives and Broodminder© scales underneath www.broodminder.com
The internal sensors measure the temperature of the brood nest and humidity providing important information such as queenright status, and how well the bees are managing fluctuations in outside temperature and interior humidity levels.
The sensors can also predict events such as swarming, when there is a spike in the temperature as thousands of bees warm up their flight muscles ready for take-off.
I’m still unsure how to fully apply the data I’m collecting from the sensors to my day-to-day beekeeping and confess, as you will gather from this blog, I am finding the scales the most useful at this early stage,
The colonies are reducing in numbers, and the short-lived summer bees have given way to their longer-lived winter sisters. Each colony has at least two full supers of honey to give them more than 20kg of stores for the winter, plus the stores they have laid down in the brood box.
The ivy, and related species such as this magnificent fatsia in my garden, is still in flower so the foraging season is not yet over.
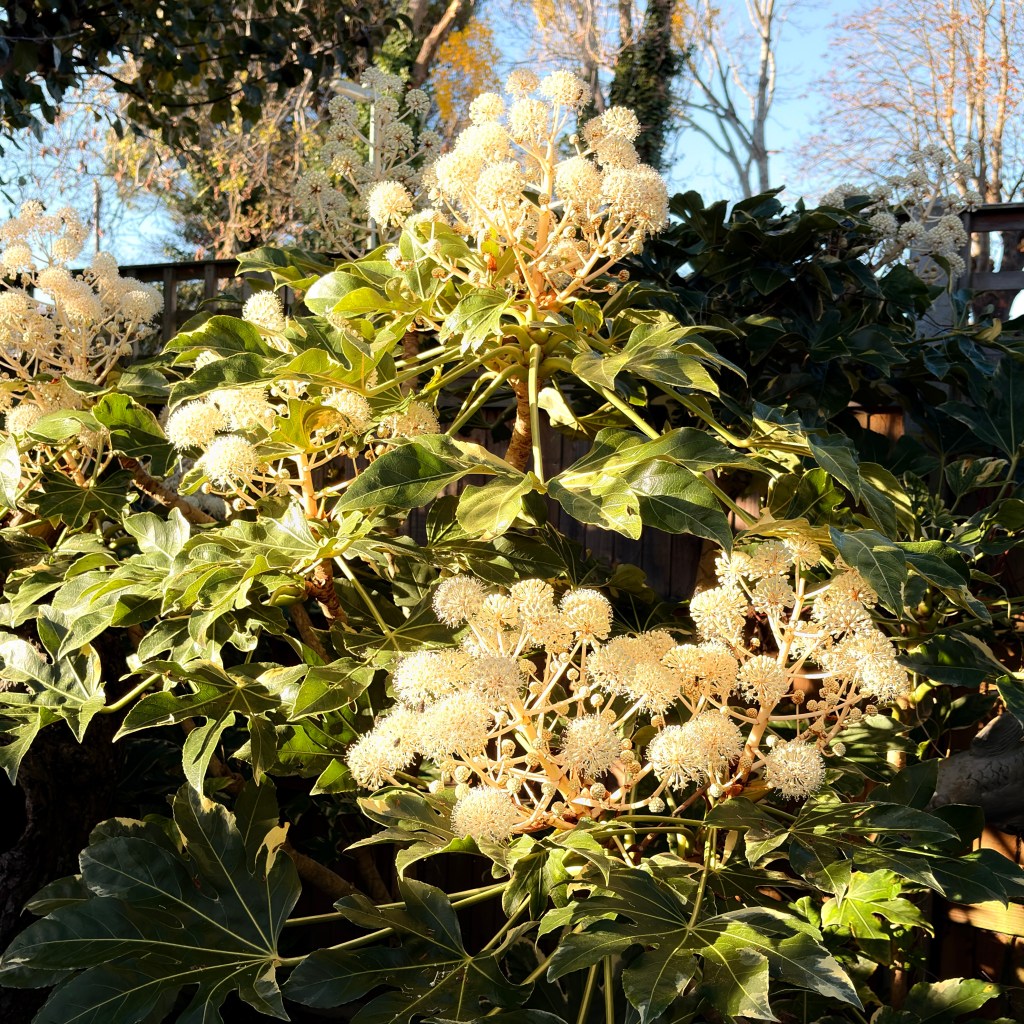
We’re in a brief cold spell at the moment but I doubt that it will continue for long enough to stop the queen laying and give the bees a winter brood break.
I’ve also signed up for Apiary Forecast© www.apiaryforecast.com
which provides highly localized weather and plant information of interest to beekeepers.
My three apiaries
I keep bees in three places, all within a few miles of each other, nestling in this sheltered corner of the south coast, between the South Downs and the Solent, protected from the westerly winds by the Isle of Wight.
The Teaching Apiary at Ranvilles Lane is where we hold our Help & Learn sessions for Fareham & District BKA members. It is a busy place. The colonies are opened every week during the season so that trainees can handle frames, find the queen and learn to read the brood, which means the bees there are subject to regular disruption. That’s a price well worth paying, but it shows up in the data, and I’ve had to allow for it. It is also where the hive scales and most of the brood sensors live.
My home apiary is in the garden. This year I transferred all the colonies there into poly hives. It will be interesting to see how they come through the winter compared with their counterparts in cedar hives with a layer of insulation in the roof all year-round.
The third apiary is at Fishers Hill. Where we put collected swarms of unknown origin for disease inspection and monitoring for varroa and temperament before they are passed on to another beekeeper. In the past it has served as an isolation apiary, notably when one of my colonies suffered from Chronic Bee Paralysis (see my blog of 14/08/2026).
The year in a nutshell
2026 was warm and dry, with two good nectar flows and a long, late summer. Every month from March to October was warmer than the 2011–2025 average, and from March to September we had only about two-thirds of our usual rain. July had just 4 mm. The scale hives put on most of their weight in two bursts, an early spring flow in April and a short, strong flow in the second half of June. From mid-July until the ivy came out, the bees lived mostly on what they had stored.
The weather
After a very wet winter, when January and February each had more than twice their usual rain, the taps were turned off. A dry, sunny spell from 18 March and the first warm days on 7–9 April, up to 20°C, set the bees working early. Late May brought a mini heatwave, with 28°C every day from the 22nd to the 28th, and then the first eleven days of June turned cool, windy and wet, with 75 mm of rain.
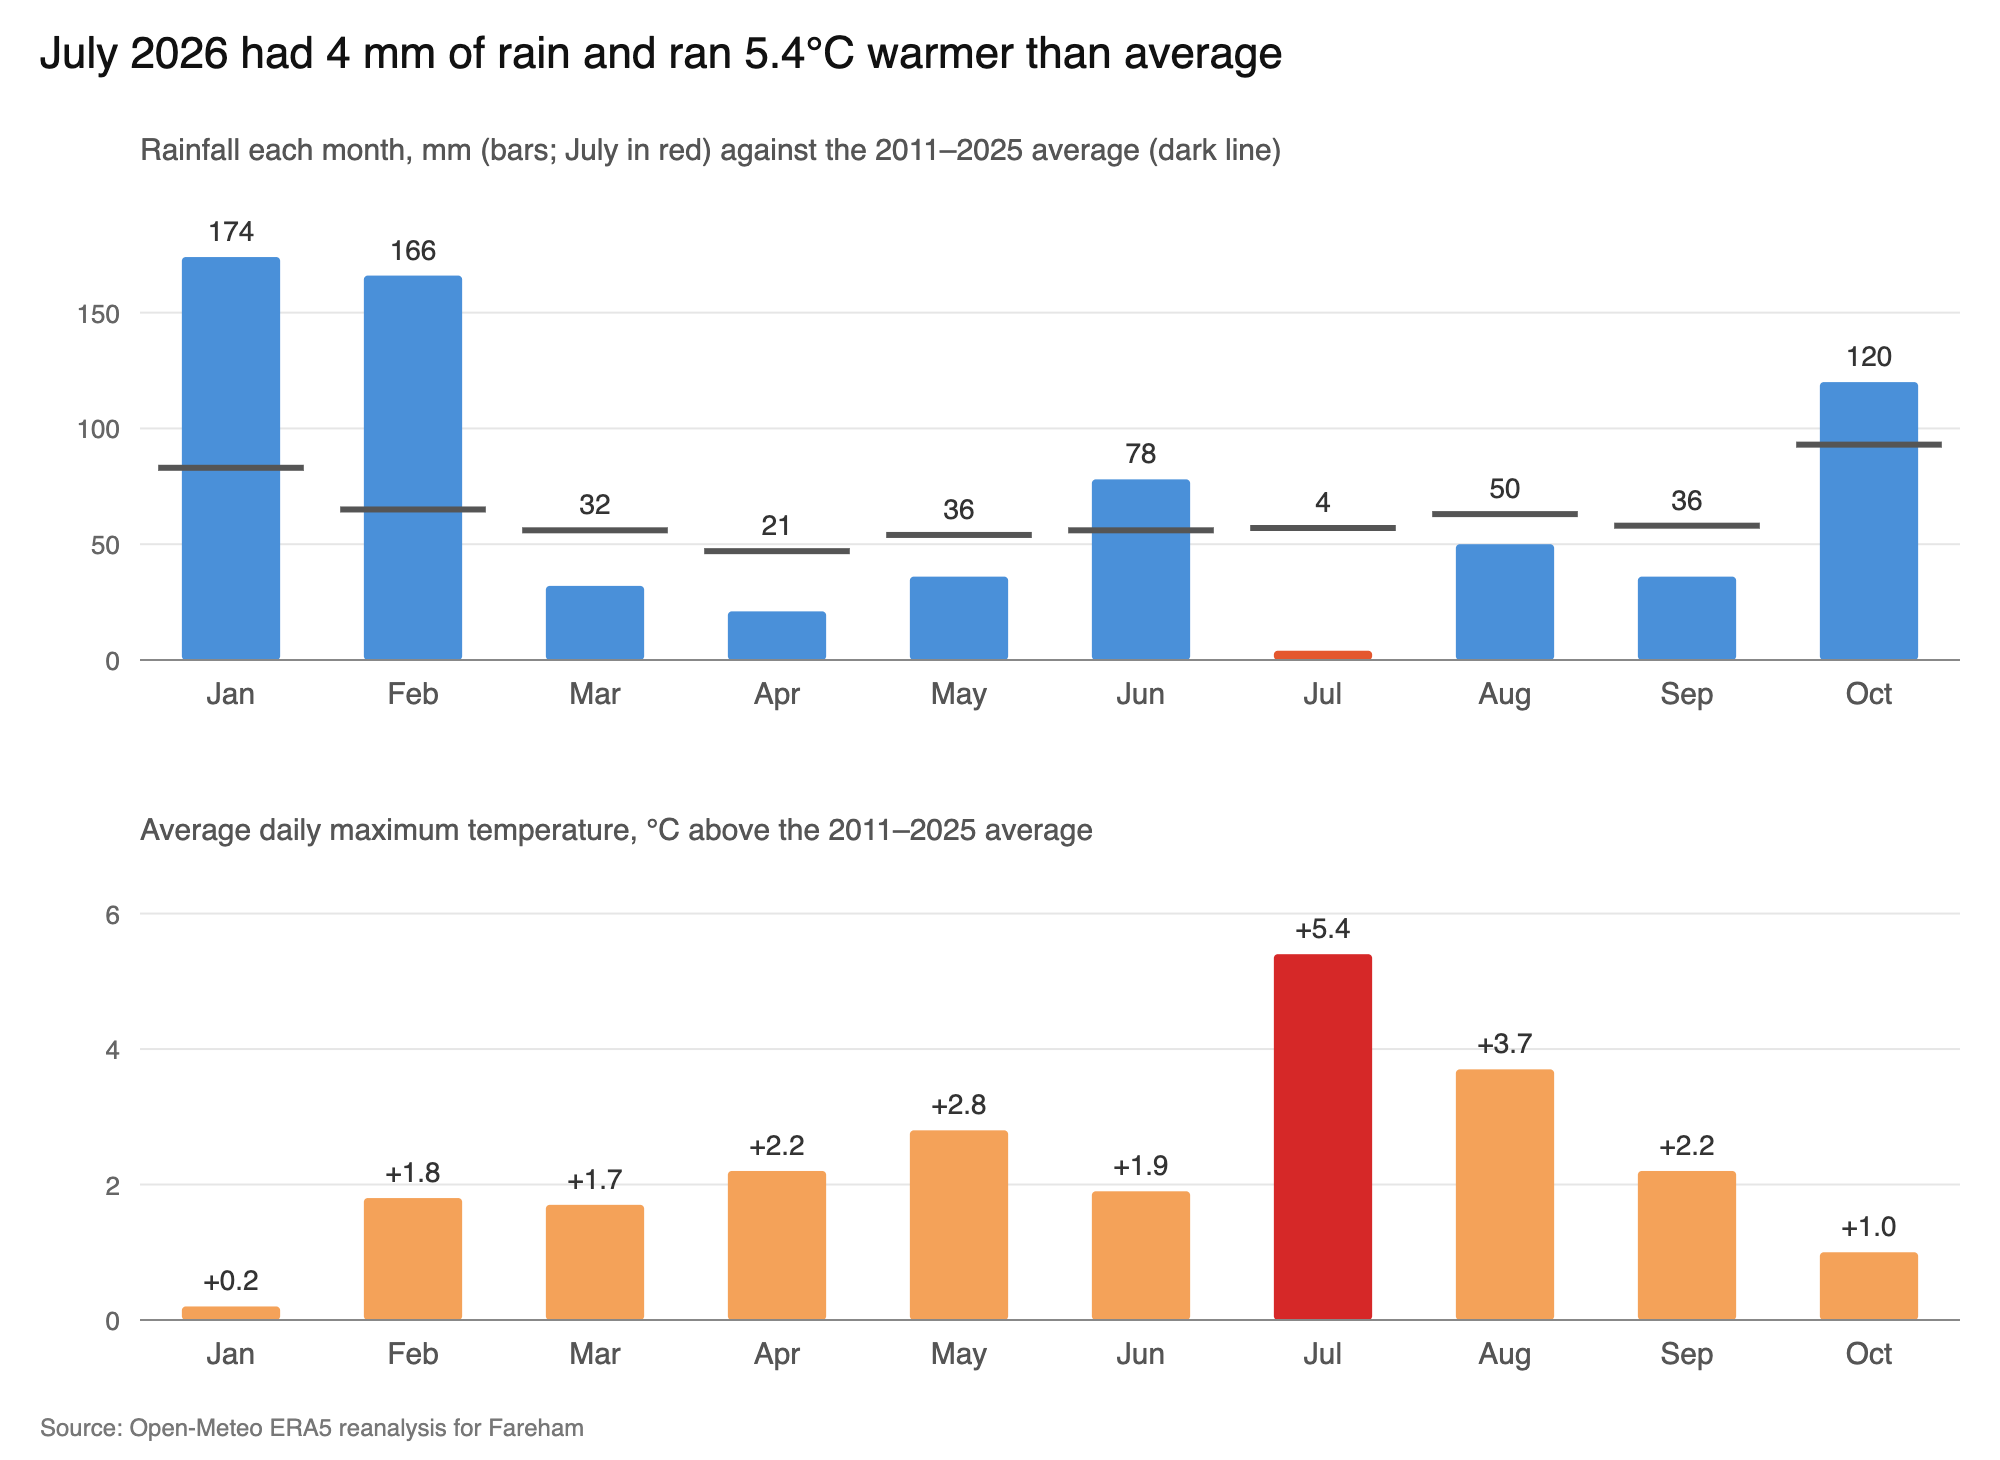
The hottest day was 24 June, at 35°C. July brought a drought. Every day reached at least 24°C, ten days in a row topped 28°C, and it hardly rained all month. The rain finally came back in late August, and properly from 20 October, with 87 mm in five days.
Flying weather was never the problem. I counted 25 good flying days in May and 31 in July. Later in the summer the bees could fly, but there was very little for them to fly to.
What the sensors record
Before we look at what the scales showed over the whole season, it’s worth showing what the BroodMinder sensors actually record, because the detail is fascinating. Each sensor logs a reading every hour, and the scale weighs the whole hive at the same time. Here is one colony, hive D, during the best ten days of the year, 18 to 27 June.
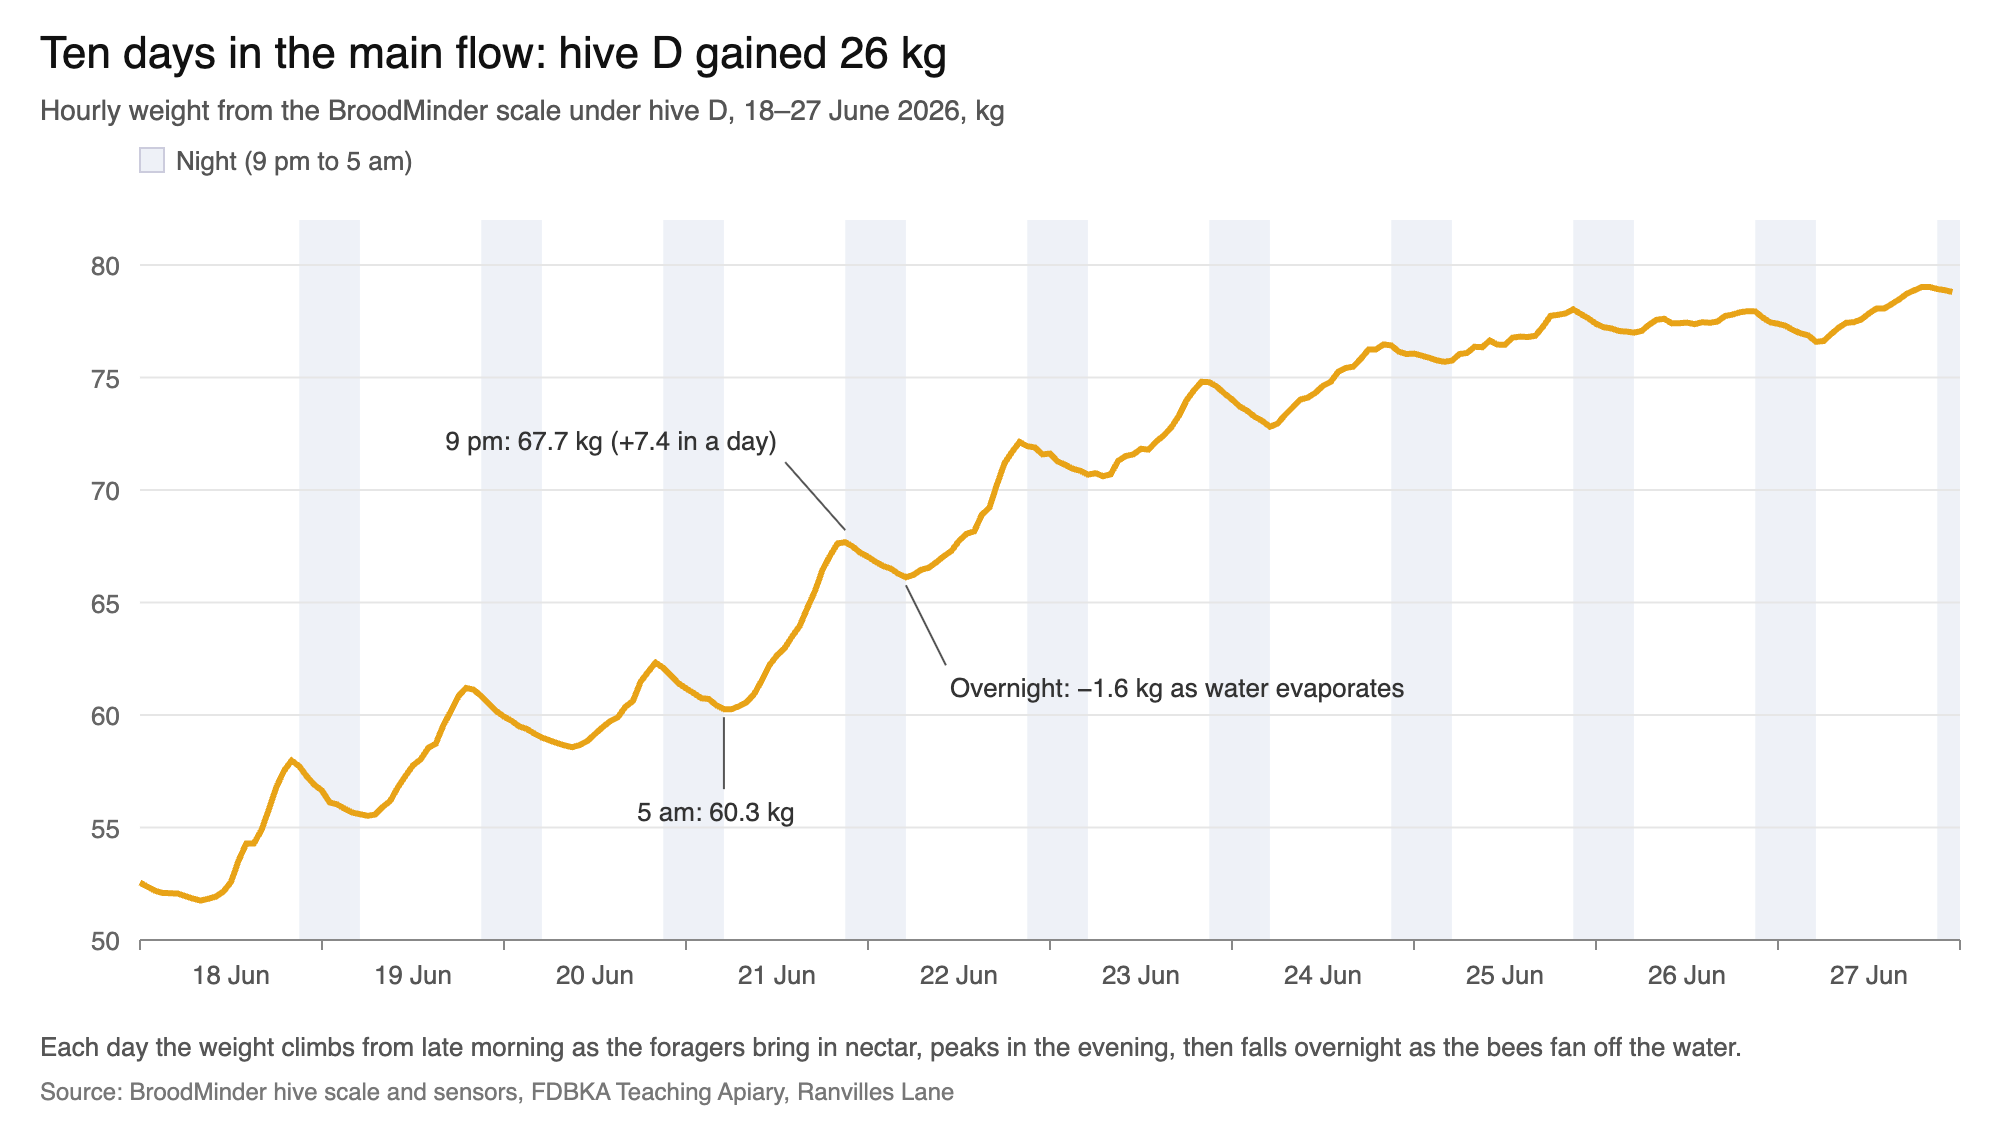
You can almost watch the bees at work. Each morning the weight holds steady while the foragers get going, then from late morning it climbs as the nectar comes in, peaking at around 8 or 9 in the evening when everyone is home. Overnight it falls back as the bees fan the water off the fresh nectar to ripen it into honey. On 21 June hive D put on 7.4 kg between 5 am and 9 pm, and lost 1.6 kg of that overnight. By the 26th the flow was easing and the daily climb had all but flattened out.
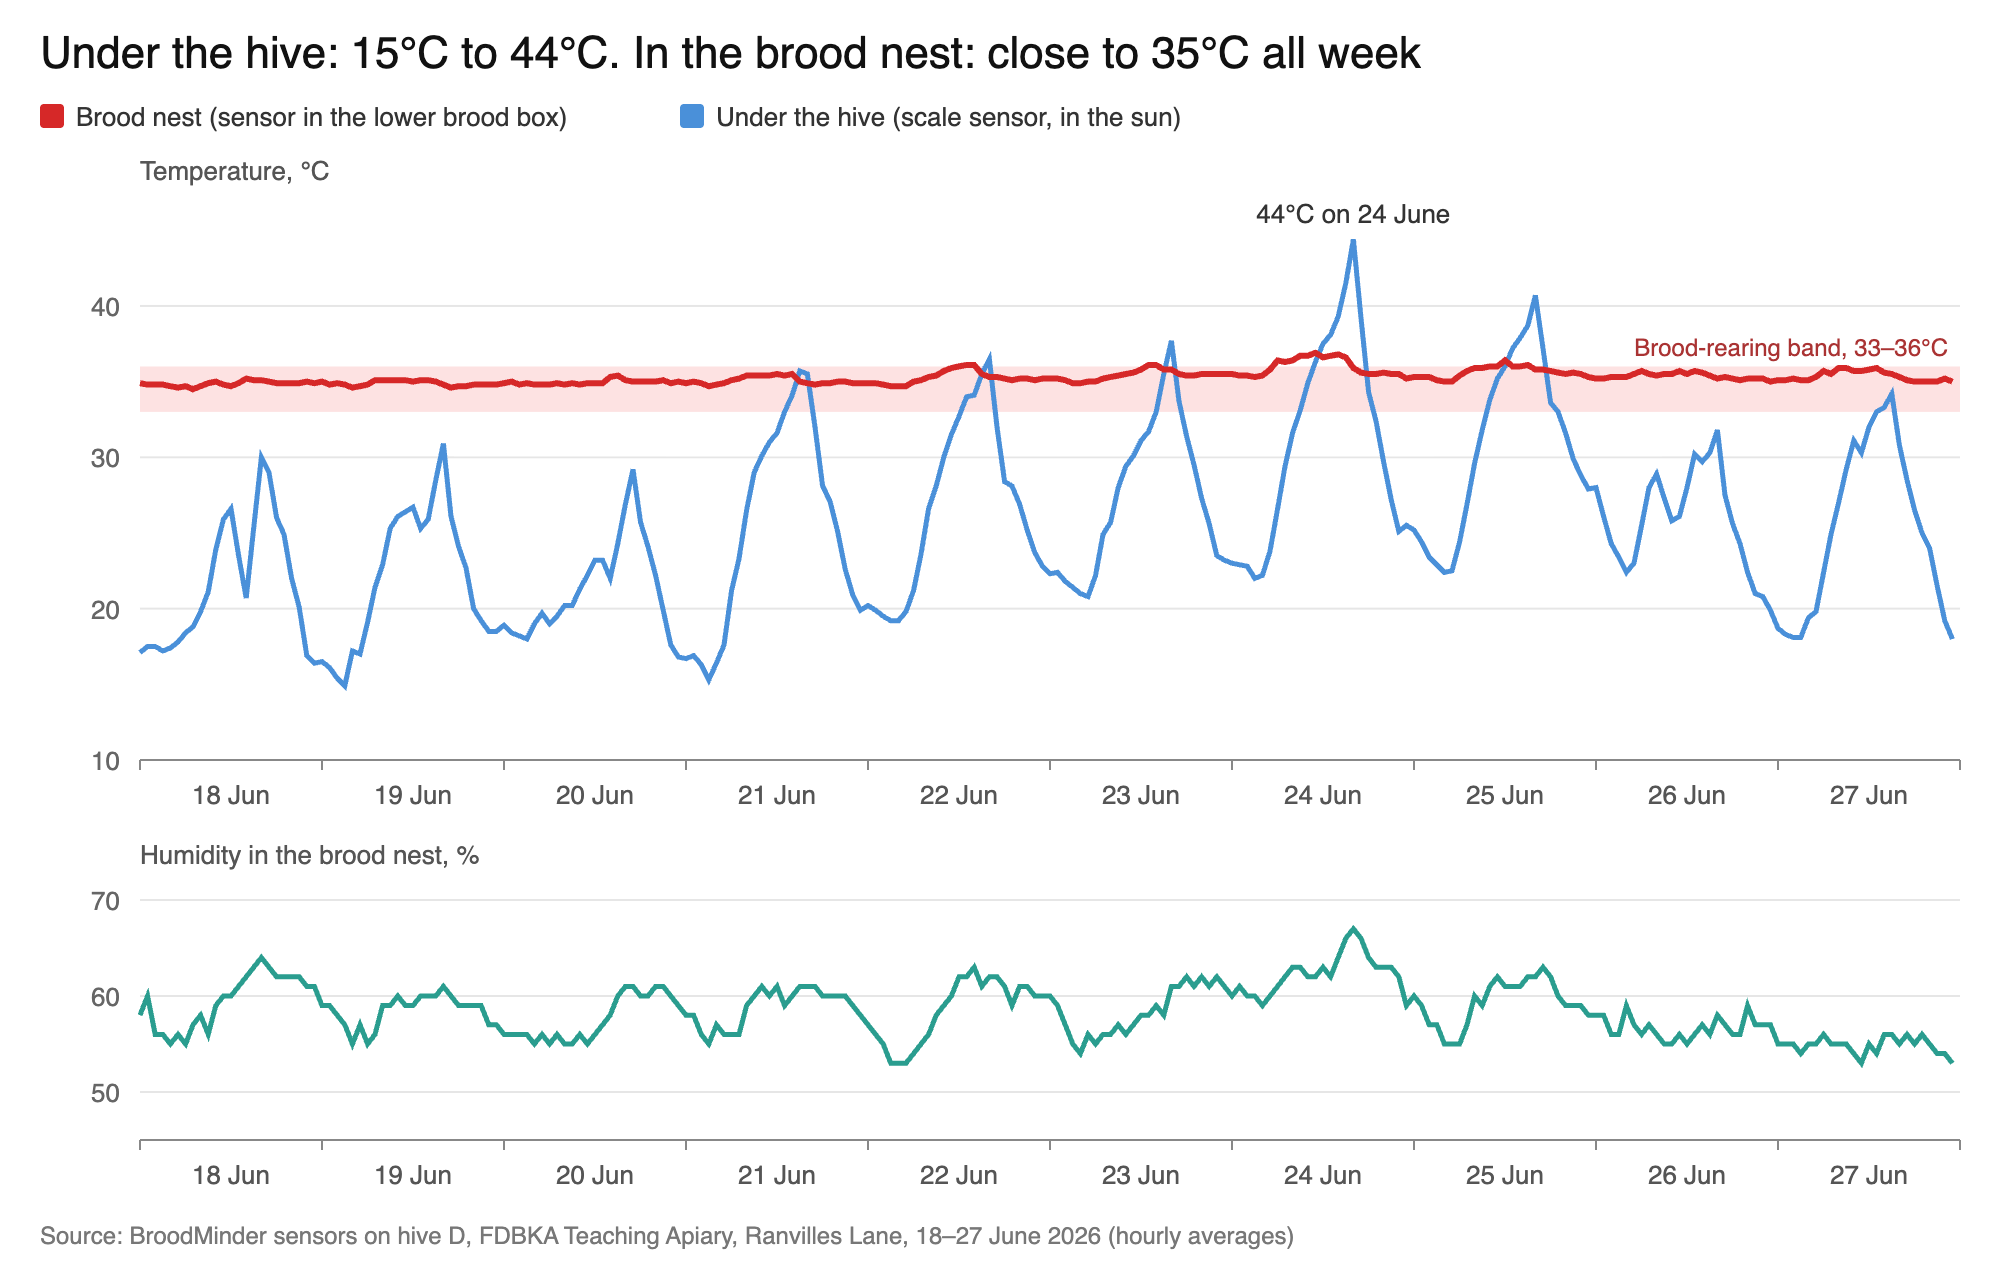
The temperature sensors tell a different story. Under the hive, where the scale sits in full sun, the temperature swung from 15°C at night to 44°C on the afternoon of 24 June. In the brood nest it barely moved, staying between 34.5 and 37°C all week, right in the band the brood needs. The bees must have been working hard to keep it there on the hottest days. The humidity in the brood nest rises each afternoon and evening as the fresh, watery nectar comes in, then falls again overnight as it is dried off.
What the hive scales told us
A hive scale is the most honest forage survey there is. I read the weight at night, when the foragers are home, and took out the jumps caused by us rather than the bees: supers on and off, splits, the weekly training inspections and the harvest. What’s left is the colony’s own gain or loss each week. One scale sat under hive H7 until 21 May and then moved to hive D; the other was under hive E from late April.
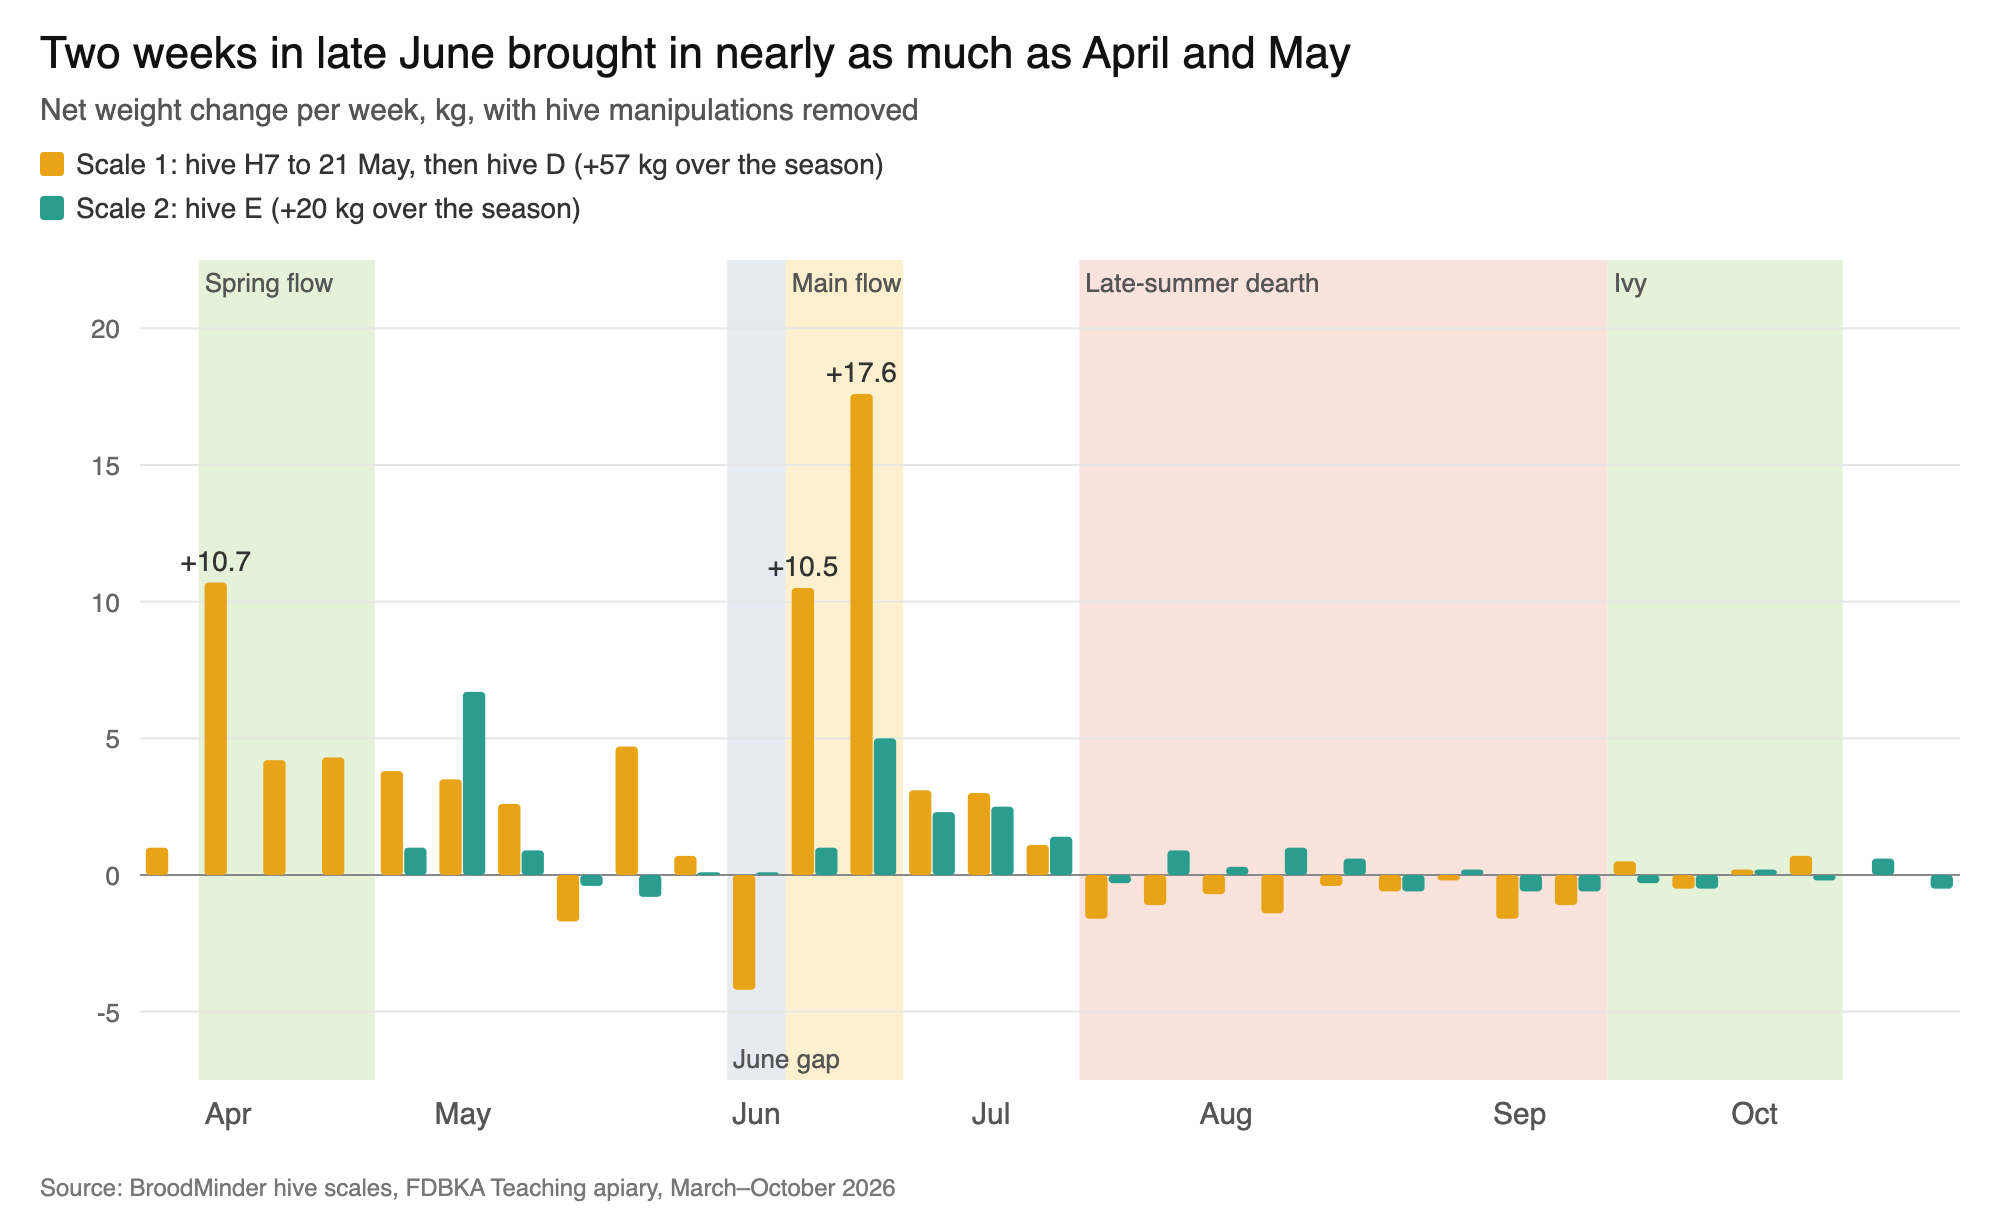
The spring flow came with the first warm week of April. H7 put on 10.7 kg in a single week and about 20 kg by the end of the month, while E added 6.7 kg in the first week of May. Then the June gap: the cold, wet start to June and the end of the spring blossom stopped everything, and hive D lost 4.2 kg in the week from 7 June.
The main flow, from 14 to 28 June, was short and strong. Hive D gained 28 kg in a fortnight, 5.8 kg on 22 June alone. That is nearly as much as the 33 kg the first scale recorded across the whole of April and May.
Then came a long dearth. After a few small gains in early July, hive D lost weight slowly for eight weeks, about 9 kg in all, until mid-September. The ivy stopped the losses in late September and October, but there was no real gain. This year it kept the colonies going rather than filling the boxes. Over the season, the first scale recorded about 57 kg of the colonies’ own gain and hive E about 20 kg.
What was in flower
Apiary Forecast© has a forage index that uses the BSBI Plant Atlas to list the bee plants recorded within about 8 km of each apiary, with an estimated flowering window for each. I looked up the main nectar and pollen plants and set them against what the scales recorded.
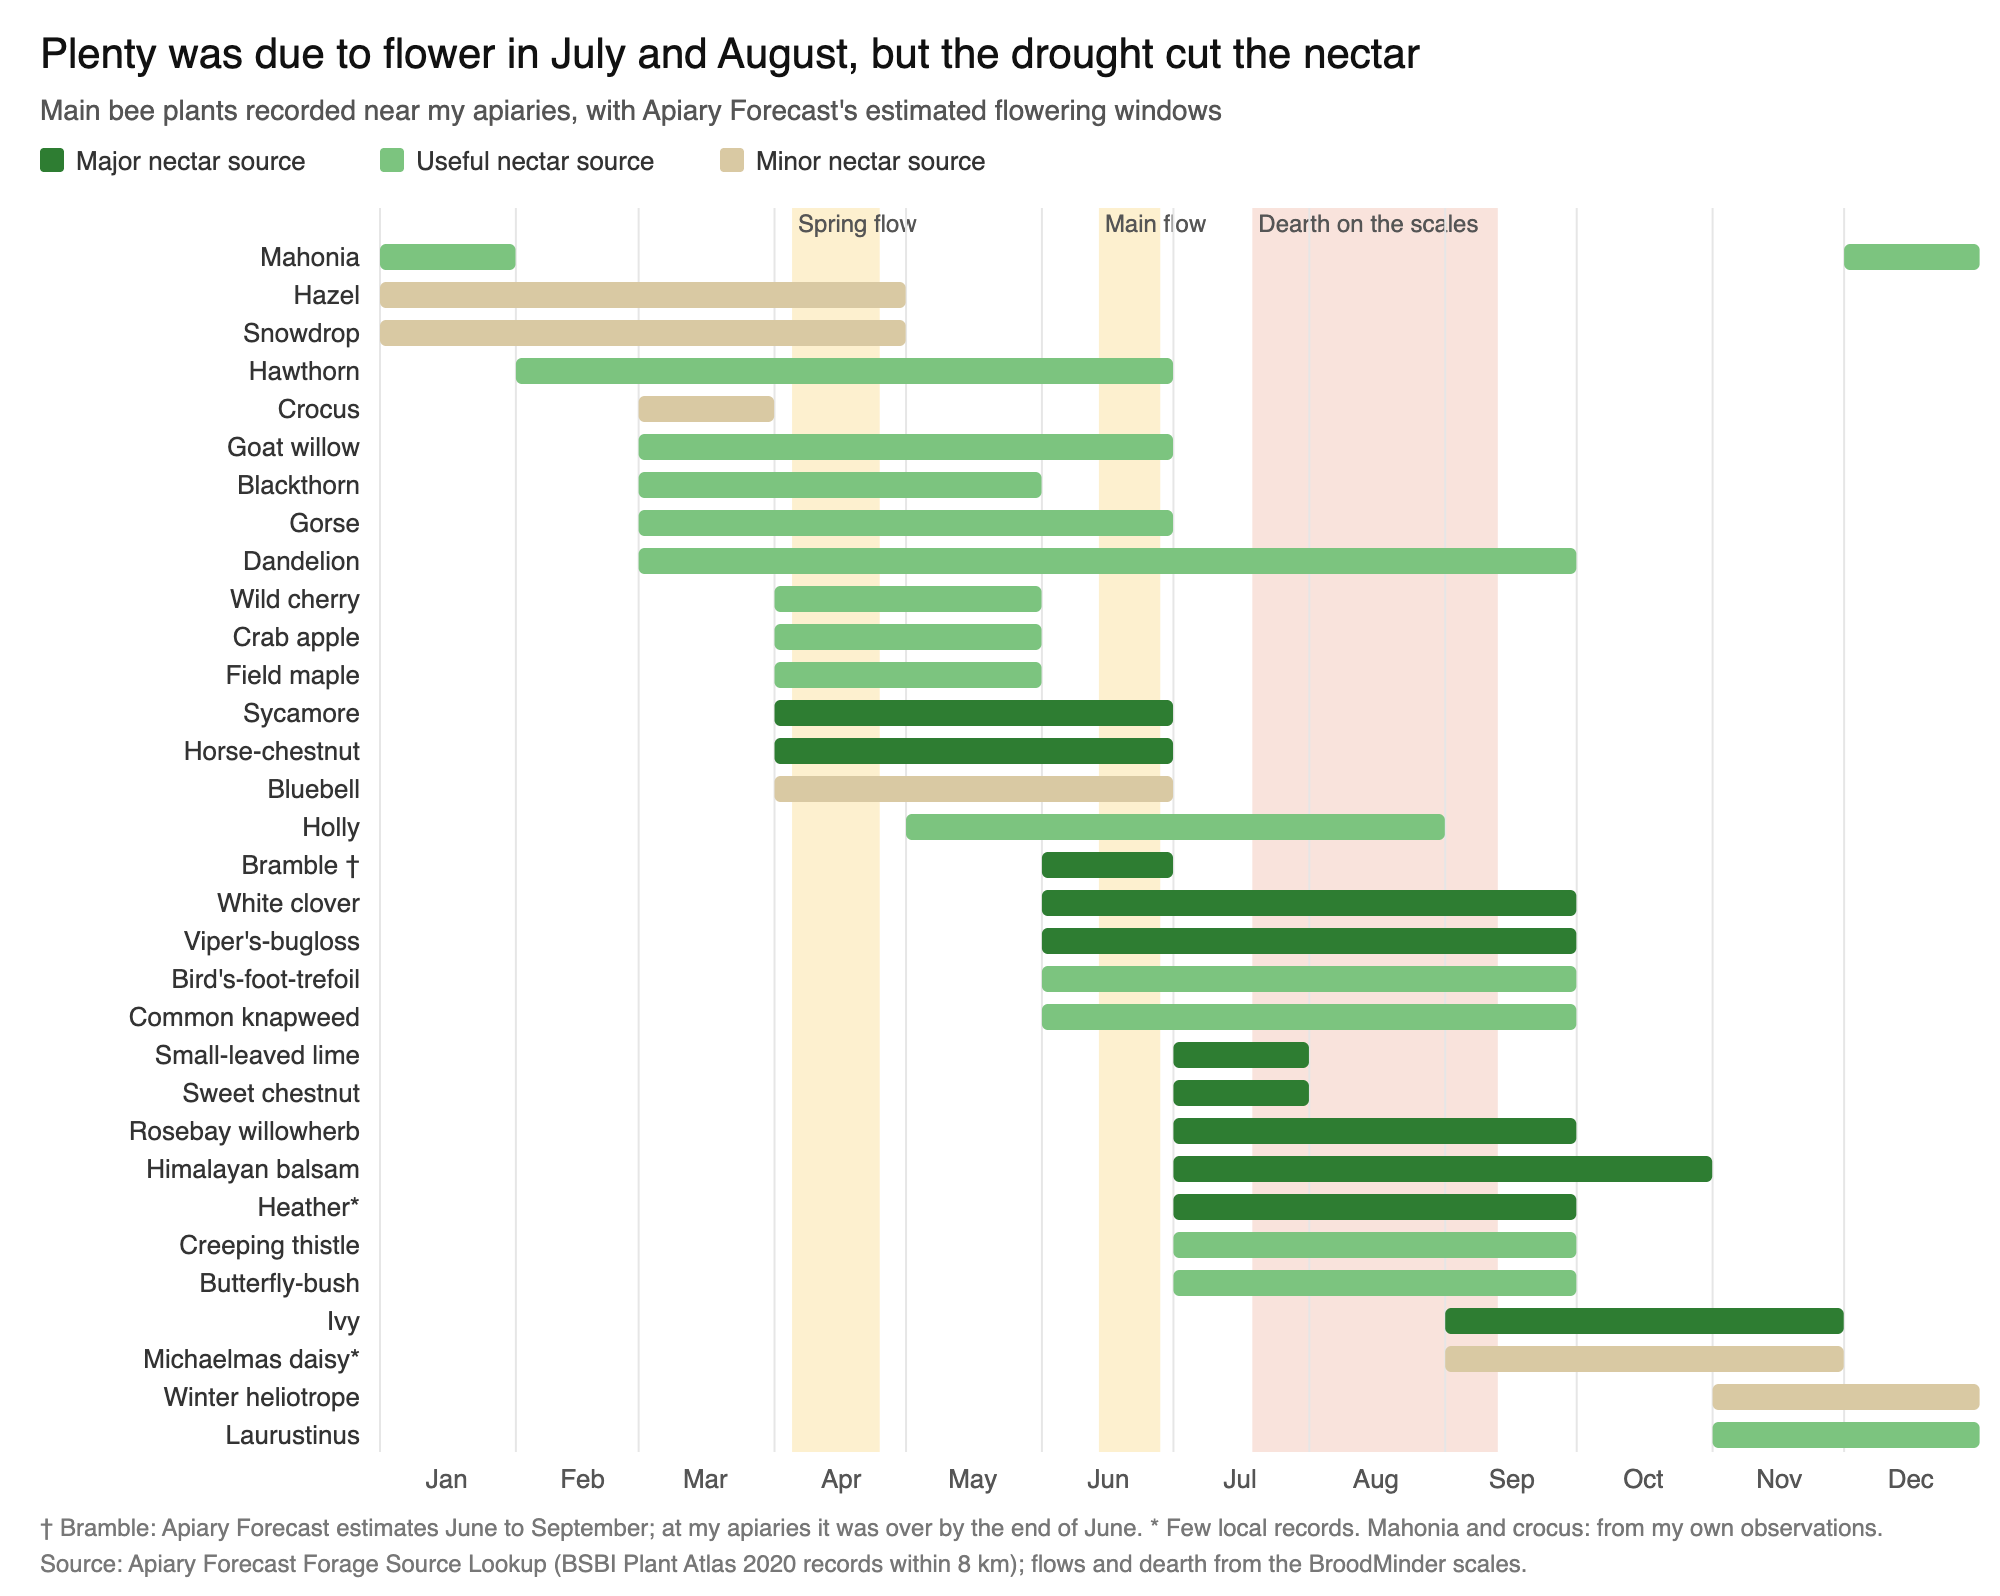
Over the winter, Mahonia flowers in December and January. In spring we had hazel and snowdrop from January, then crocus, goat willow, blackthorn, gorse and dandelion from March, and wild cherry, crab apple, field maple, sycamore and horse-chestnut in April and May. Sycamore and horse-chestnut are the big nectar sources of that group, and they fit the April flow.
The main flow in late June lines up with the bramble, white clover, small-leaved lime and sweet chestnut. But here’s the surprise. On paper, July to September should have been well supplied, with clover, rosebay willowherb, Himalayan balsam, thistles and buddleia all due to flower. Yet the scales went backwards for eight weeks. The bramble, which usually carries on into July, was over by the end of June. Dry weather can cut the nectar even while the flowers are still there, and despite July’s 4 mm of rain, did exactly that. The flowers were there; the nectar wasn’t.
The autumn
Apiary Forecast© also scores the likely nectar and pollen collection at each apiary every day. It only keeps 30 days of history, so it covers mid-October to now, but it tells the same story as the scales during that period.
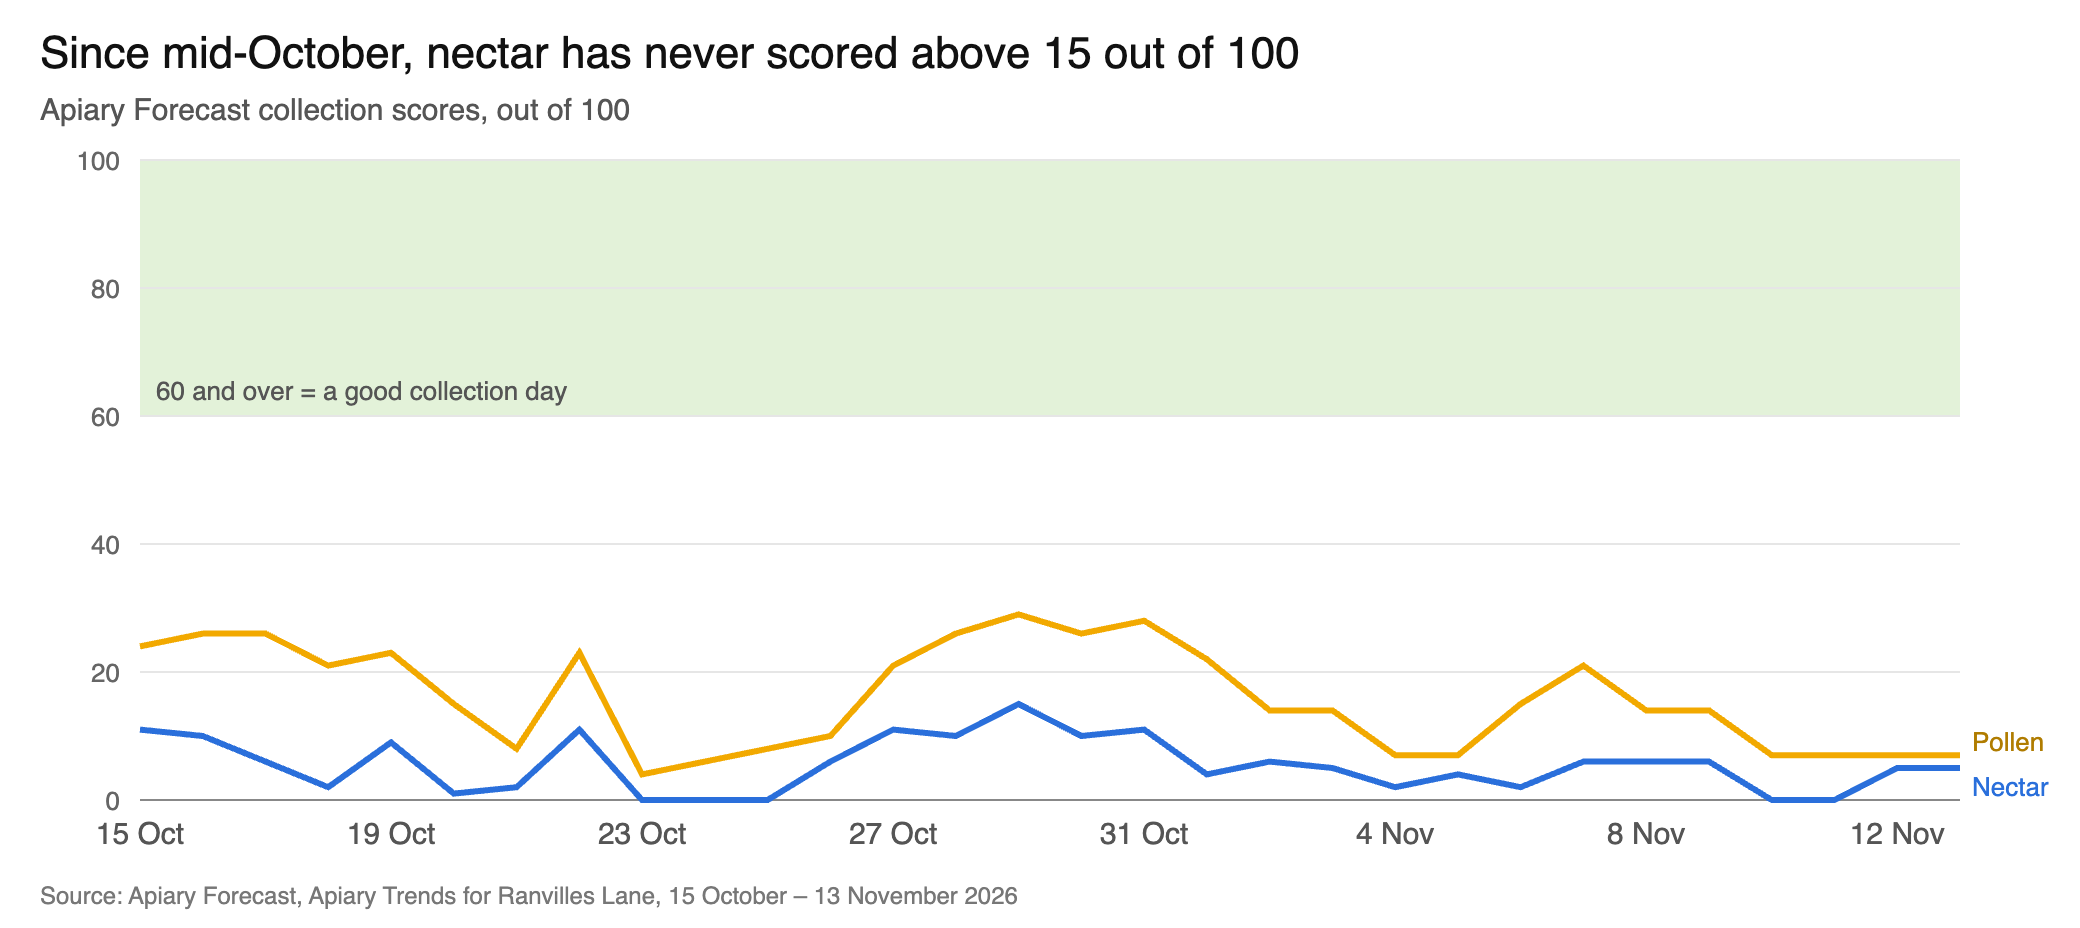
Nectar has scored between 0 and 15 out of 100 and pollen between 4 and 29, never close to the 60 that marks a good collection day. Stores pressure was flagged on every one of the 30 days. The last useful spell was 27–31 October, and since 10 November nectar has barely registered. All three apiaries scored almost exactly the same.
Inside the hive
The brood sensors show the colonies coping well with the heat. On 24 June, when it was 35°C outside, the brood in hive D stayed between 34 and 36.9°C. The bees were doing a good job of keeping the nest cool.
In April, about 69% of the readings sat in the 33–36°C brood-rearing band. That fell to 43% in July, 27% in August and just 11% in September, and from mid-September hive D’s sensor read below 30°C on most days. With so little coming in after mid-July, the winter bees may have been raised in a dearth. That makes good varroa control and adequate stores all the more important this winter.
However, this is not an accurate interpretation of the readings. The sensors are positioned in the middle on the brood boxes above where the brood nest is located. Once the brood nest moves to a different part of the hive the readings are less indicative of the real situation.
Lessons for 2027
- Get the supers on early. The spring flow arrived with the first warm week of April.
- Watch the June gap. A cold, wet week in early June cost one colony 4 kg. Nucs and splits made up in May may need feeding.
- Be ready for a short main flow. Most of this summer’s crop came in about 14 days. Supers need to be on, with space, before the lime and bramble open.
- Expect a dearth after mid-July in a dry year. Take the crop early and check stores by hefting, not guesswork, or by taking readings from scales.
- Don’t count on the ivy. It stopped the losses this autumn but added nothing to the stores.
- Use a scale as an early warning. Three days of weight losses in a row between May and July is the time to check for starvation in nucs, or swarming in full colonies
Now is the time to heft your hives. If they feel light, don’t wait put fondant on now, directly over the cluster where the bees can reach it.
Where the data comes from: hive weights and brood temperatures from BroodMinder© sensors at the Teaching Apiary, March–October 2026; weather from the Open-Meteo ERA5 reanalysis for Fareham, compared with 2011–2025; forage scores and flowering windows from Apiary Forecast,© based on BSBI Plant Atlas 2020 records.


Leave a Reply